MA RSI @KINGThis Pine Script is designed to create a trading indicator with moving averages (MA) and relative strength index (RSI), along with arrow signals and background color changes based on those signals. Here's a description of its functions:
1. Moving Averages and RSI Calculation:
- Two moving averages (`fastMA` and `slowMA`) are calculated based on user-input lengths.
- The Relative Strength Index (`rsi`) is calculated based on a user-defined length.
2. Crossover Conditions:
- `crossoverUp` is true when the fastMA crosses above the slowMA and RSI is above an overbought level.
- `crossoverDown` is true when the fastMA crosses below the slowMA and RSI is below an oversold level.
3. Arrow Signals:
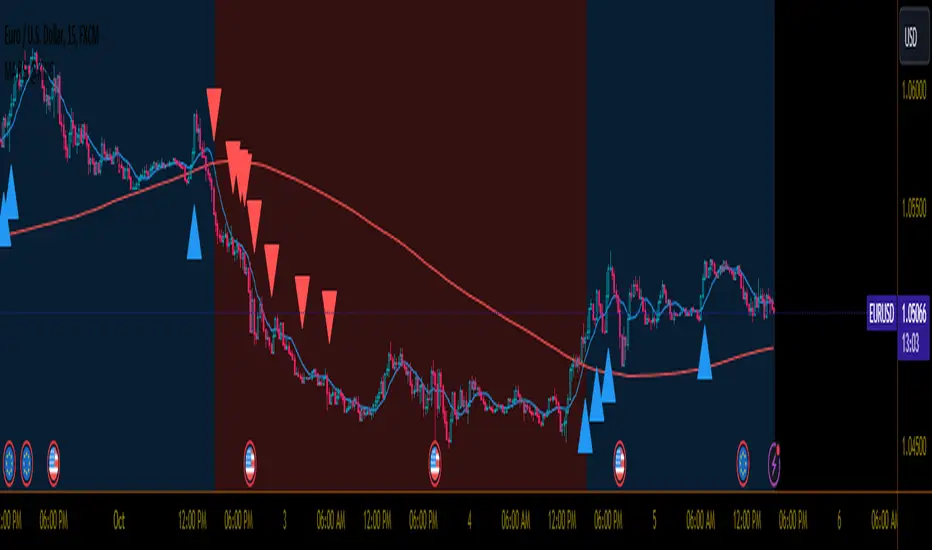
- Triangle-shaped arrows (`arrowUp` and `arrowDown`) are plotted below and above bars, indicating buy (green) and sell (red) signals, respectively.
4. Background Color Changes:
- The background color (`bgColor`) changes based on buy and sell signals.
- If there's a buy signal (`crossoverUp`), the background color is set to a light blue with 40% transparency.
- If there's a sell signal (`crossoverDown`), the background color is set to a light red with 40% transparency.
- On the next opposite signal, the background color is scaled up (transparency set to 80%) to indicate a stronger signal.
In summary, this script provides visual cues through arrows and background color changes to assist traders in identifying potential buy and sell signals based on moving average crossovers and RSI conditions. The background color variations aim to highlight the strength of the signal, with scaling based on consecutive signals in the same direction.
********************************************************************************
1. Buy Signal:
- Condition: The arrow points up (green) with a background color indicating a buy signal.
- Confirmation: Ensure that there is a strong upward crossover (fastMA above slowMA) and RSI is above the overbought level.
2. Sell Signal:
- Condition: The arrow points down (red) with a background color indicating a sell signal.
- Confirmation: Ensure that there is a strong downward crossover (fastMA below slowMA) and RSI is below the oversold level.
3. Exit Signal:
- Condition: No arrow is present, and the background color is reset.
- Confirmation: Confirm that there is no active buy or sell signal.
Example Trading Rules:
Opening a Long Position (Buy):
- Enter a long (buy) position when:
- The green arrow appears with a light blue background.
- Confirm that the fastMA is above the slowMA.
- Confirm that RSI is above the overbought level.
Opening a Short Position (Sell):
- Enter a short (sell) position when:
- The red arrow appears with a light red background.
- Confirm that the fastMA is below the slowMA.
- Confirm that RSI is below the oversold level.
Exiting a Position:
- Close the position when:
- There is no arrow present (neither green nor red).
- The background color is reset, indicating no active signal.
Risk Management:
Position Sizing: Determine the size of your positions based on your risk tolerance and the size of your trading account.
Stop-Loss and Take-Profit: Set stop-loss orders to limit potential losses and take-profit orders to secure profits.
Risk-Reward Ratio: Consider maintaining a favorable risk-reward ratio in your trades.
Notes:
Backtesting: Before applying this strategy in a live market, it's crucial to backtest it using historical data to assess its performance.
Market Conditions: Adapt the strategy to different market conditions, and be aware that no strategy is guaranteed to be profitable.
Continuous Monitoring: Regularly monitor the performance of the strategy and make adjustments as needed.
Educational Purpose: This strategy is for educational purposes only. Always consult with financial professionals and use your judgment when making trading decisions.
Remember that trading involves risk, and past performance is not indicative of future results. It's recommended to paper trade or use a demo account to test the strategy before risking real capital.
Best wishes on your trading journey! May your strategies be profitable, your risks well-managed, and your decisions guided by wisdom and success. Happy trading!
Buscar en scripts para "Relative Strength Index (RSI)"
Divergences RefurbishedJust as "a butterfly can flap its wings over a flower in China and cause a hurricane in the Caribbean" (Edward Lorenz), small divergences in markets can signal big trading opportunities.
█Introduction
This is a script forked from LonesomeTheBlue's Divergence for Many Indicators v4.
It is a script that checks for divergence between price and many indicators.
In this version, I added more indicators and also added 40 symbols to check for divergences.
More info on the original script can be found here:
█ Improvements
The following improvements have been implemented over v4:
1. Added parameters to customize indicators.
2. Added new indicators:
- Stoch RSI
- Volume Oscillator
- PVT (Price Volume Trend)
- Ultimate Oscillator
- Fisher Transform
- Z-Score/T-Score
3. Now there is the possibility of using 2 external indicators.
4. New option to show tooltips inside labels.
This allows you to save space on the screen if you choose the option to only show the number of divergences or just the abbreviations.
5. New option to show additional text next to the indicator name.
This allows for grouping of indicators and symbols and better visualization, whether through emojis, for example.
6. Added 40 customizable symbols to check for divergences.
7. Option "show only the first letter" of the indicator replaced by: "show the abbreviation of the indicator".
Reason: the indicator abbreviation is more informative and easier to read.
8. Script converted to PineScript version 5.
█ CONCEPTS
Below I present a brief description of the available indicators.
1. Moving Average Convergence/Divergence (MACD):
Shows the difference between short-term and long-term exponential moving averages.
2. MACD Histogram:
Shows the difference between MACD and its signal line.
3. Relative Strength Index (RSI):
Measures the relative strength of recent price gains to recent price losses of an asset.
4. Stochastic Oscillator (Stoch):
Compares the current price of an asset to its price range over a specified time period.
5. Stoch RSI:
Stochastic of RSI.
6. Commodity Channel Index (CCI):
Measures the relationship between an asset's current price and its moving average.
7. Momentum: Shows the difference between the current price and the price a few periods ago.
Shows the difference between the current price and the price of a certain period in the past.
8. Chaikin Money Flow (CMF):
A variation of A/D that takes into account the daily price variation and weighs trading volume accordingly. Accumulation/Distribution (A/D) identifies buying and selling pressure by tracking the flow of money into and out of an asset based on volume patterns.
9. On-Balance Volume (OBV):
Identify divergences between trading volume and an asset's price.
Sum of trading volume when the price rises and subtracts volume when the price falls.
10. Money Flow Index (MFI):
Measures volume pressure in a range of 0 to 100.
Calculates the ratio of volume when the price goes up and when the price goes down.
11. Volume Oscillator (VO):
Identify divergences between trading volume and an asset's price. Ratio of change of volume, from a fast period in relation to a long period.
12. Price-Volume Trend (PVT):
Identify the strength of an asset's price trend based on its trading volume. Cumulative change in price with volume factor. The PVT calculation is similar to the OBV calculation, but it takes into account the percentage price change multiplied by the current volume, plus the previous PVT value.
13. Ultimate Oscillator (UO):
Combines three different time periods to help identify possible reversal points.
14. Fisher Transform (FT):
Normalize prices into a Gaussian normal distribution.
15. Z-Score/T-Score: Shows the difference between the current price and the price a few periods ago. I is a statistical measurement that indicates how many standard deviations a data point is from the mean of a data set.
When to use t-score instead of z-score? When the sample size is small (length < 30).
Here, the use of z-score or t-score is chosen automatically based on the length parameter.
█ What to look for
The operation is simple. The script checks for divergences between the price and the selected indicators.
Now with the possibility of using multiple symbols, it is possible to check divergences between different assets.
A well-described view on divergences can be found in this cheat sheet:
◈ Examples with SPY ETF versus indicators:
1. Regular bullish divergence with external indicator:
1. Regular bearish divergence with Fisher Transform:
1. Positive hidden divergence with Momentum indicator:
1. Negative hidden divergence with RSI:
◈ Examples with SPY ETF versus other symbols:
1. Regular bearish divergence with European Stoch Market:
2. Regular bearish divergence with DXY inverted:
3. Regular bullish divergence with Taiwan Dollar:
4. Regular bearish divergence with US10Y (10-Year US Treasury Note):
5. Regular bullish divergence with QQQ ETF (Nasdaq 100):
6. Regular bullish divergence with ARKK ETF (ARK Innovation):
7.Positive hidden divergence with RSP ETF (S&P 500 Equal Weight):
8. Negative hidden divergence with EWZ ETF (Brazil):
◈ Examples with BTCUSD versus other symbols:
1. Regular bearish divergence with BTCUSDLONGS from Bitfinex:
2. Regular bearish divergence with BLOK ETF (Amplify Transformational Data Sharing):
3. Negative hidden divergence with NATGAS (Natural Gas):
4. Positive hidden divergence with TOTALDEFI (Total DeFi Market Cap):
█ Conclusion
The symbols available to check divergences were chosen in such a way as to cover the main markets, in the most generic way possible.
You can adjust them according to your needs.
A trader in the American market, for example, could add more ETFs, American stocks, and sectoral indices, such as the XLF (Financial Select Sector SPDR Fund), the XLK (Technology Select Sector SPDR), etc.
On the other hand, a cryptocurrency trader could add more currency pairs and sector indicators, such as BTCUSDSHORTS (Bitfinex), USDT.D (Tether Dominance), etc.
If the chart becomes too cluttered, you can use the option to show only the number of divergences or only the indicator abbreviations.
Or even disable certain indicators and symbols, if they are not of interest to you.
I hope this script is useful.
Don't forget to support LonesomeTheBlue's work too.

Volume ValueWhen VelocityTitle: Volume ValueWhen Velocity Trading Strategy
▶ Introduction:
The " Volume ValueWhen Velocity " trading strategy is designed to generate long position signals based on various technical conditions, including volume thresholds, RSI (Relative Strength Index), and price action relative to the Simple Moving Average (SMA). The strategy aims to identify potential buy opportunities when specific criteria are met, helping traders capitalize on potential bullish movements.
▶ How to use and conditions
★ Important : Only on Spot Binance BINANCE:BTCUSDT
Name: Volume ValueWhen Velocity
Operating mode: Long on Spot BINANCE BINANCE:BTCUSDT
Timeframe: Only one hour
Market: Crypto
currency: Bitcoin only
Signal type: Medium or short term
Entry: All sections in the Technical Indicators and Conditions section must be saved to enter (This is explained below)
Exit: Based on loss limit and profit limit It is removed in the settings section
Backtesting:
⁃ Exchange: BINANCE BINANCE:BTCUSDT
⁃ Pair: BTCUSDT
⁃ Timeframe:1h
⁃ Fee: 0.1%
- Initial Capital: 1,000 USDT
- Position sizing: 500 usdt
-Trading Range: 2022-07-01 11:30 ___ 2023-07-21 14:30
▶ Strategy Settings and Parameters:
1. `strategy(title='Volume ValueWhen Velocity', ...`: Sets the strategy title, initial capital, default quantity type, default quantity value, commission value, and trading currency.
↬ Stop-Loss and Take-Profit Settings:
1. long_stoploss_value and long_stoploss_percentage : Define the stop-loss percentage for long positions.
2. long_takeprofit_value and long_takeprofit_percentage : Define the take-profit percentage for long positions.
↬ ValueWhen Occurrence Parameters:
1. occurrence_ValueWhen_1 and occurrence_ValueWhen_2 : Control the occurrences of value events.
2. `distance_value`: Specifies the minimum distance between occurrences of ValueWhen 1 and ValueWhen 2.
↬ RSI Settings:
1. rsi_over_sold and rsi_length : Define the oversold level and RSI length for RSI calculations.
↬ Volume Thresholds:
1. volume_threshold1 , volume_threshold2 , and volume_threshold3 : Set the volume thresholds for multiple volume conditions.
↬ ATR (Average True Range) Settings:
1. atr_small and atr_big : Specify the periods used to calculate the Average True Range.
▶ Date Range for Back-Testing:
1. start_date, end_date, start_month, end_month, start_year, and end_year : Define the date range for back-testing the strategy.
▶ Technical Indicators and Conditions:
1. rsi: Calculates the Relative Strength Index (RSI) based on the defined RSI length and the closing prices.
2. was_over_sold: Checks if the RSI was oversold in the last 10 bars.
3. getVolume and getVolume2 : Custom functions to retrieve volume data for specific bars.
4. firstCandleColor : Evaluates the color of the first candle based on different timeframes.
5. sma : Calculates the Simple Moving Average (SMA) of the closing price over 13 periods.
6. numCandles : Counts the number of candles since the close price crossed above the SMA.
7. atr1 : Checks if the ATR_small is less than ATR_big for the specified security and timeframe.
8. prevClose, prevCloseBarsAgo, and prevCloseChange : ValueWhen functions to calculate the change in the close price between specific occurrences.
9. atrval: A condition based on the ATR_value3.
▶ Buy Signal Condition:
Condition: A combination of multiple volume conditions.
buy_signal: The final buy signal condition that considers various technical conditions and their interactions.
▶ Long Strategy Execution:
1. The strategy will enter a long position (buy) when the buy_signal condition is met and within the specified date range.
2. A stop-loss and take-profit will be set for the long position to manage risk and potential profits.
▶ Conclusion:
The " Volume ValueWhen Velocity " trading strategy is designed to identify long position opportunities based on a combination of volume conditions, RSI, and price action. The strategy aims to capitalize on potential bullish movements and utilizes a stop-loss and take-profit mechanism to manage risk and optimize potential returns. Traders can use this strategy as a starting point for their own trading systems or further customize it to suit their preferences and risk appetite. It is crucial to thoroughly back-test and validate any trading strategy before deploying it in live markets.
↯ Disclaimer:
Risk Management is crucial, so adjust stop loss to your comfort level. A tight stop loss can help minimise potential losses. Use at your own risk.
How you or we can improve? Source code is open so share your ideas!
Leave a comment and smash the boost button!

RSI Signal Pro[UgurTash]Introducing RSI Signal Pro for TradingView
RSI Signal Pro is a refined version of the standard Relative Strength Index (RSI) , designed to improve signal accuracy by generating alerts in real-time instead of waiting for multiple candle confirmations. This enhancement allows traders to react faster to market movements while maintaining the familiar RSI structure.
What Makes RSI Signal Pro Unique?
✅ Real-Time RSI Signals: Unlike the traditional RSI, which waits for candle confirmations, this version provides immediate buy and sell signals upon key level crossovers.
✅ Dual Trading Modes: Choose between Simple Mode (standard RSI crossovers) and Advanced Mode (momentum-adjusted signals with price validation).
✅ Customizable RSI-Based Moving Average (MA): Optionally apply SMA, EMA, WMA, or VWMA to smooth RSI fluctuations and identify longer-term trends.
✅ Adaptive Signal Filtering: The Advanced Mode reduces false signals by filtering RSI movements with a momentum threshold and historical RSI validation.
✅ User-Friendly Interface: Simple ON/OFF toggles allow easy customization of the indicator's behavior.
How This Indicator Works
🔹 Simple Mode: Identical to traditional RSI, triggering signals when RSI crosses 30 (bullish) or 70 (bearish).
🔹 Advanced Mode: Uses historical RSI pivots, momentum verification, and price confirmation to refine signal accuracy—ideal for traders looking for more precise entries.
🔹 RSI-Based MA: Optionally overlay moving averages onto the RSI, providing additional trend confirmation.
How to Use RSI Signal Pro
1️⃣ Select a mode: Use Simple Mode for frequent alerts or Advanced Mode for refined signals.
2️⃣ Enable RSI-Based MA: Apply SMA, EMA, WMA, or VWMA to smooth RSI fluctuations.
3️⃣ Set alerts: TradingView notifications allow you to react to real-time RSI movements instantly.
4️⃣ Apply to multiple markets: Effective for crypto, forex, stocks, and commodities.
Why Use RSI Signal Pro Instead of Standard RSI?
While RSI Signal Pro maintains the core functionality of the standard RSI, its real-time signal generation allows traders to make faster decisions without the typical delay caused by waiting for candle confirmations. Additionally, the optional momentum filtering and moving average smoothing ensure fewer false signals and better trade accuracy.

Auto-Length Moving Average + Trend Signals (Zeiierman)█ Overview
The Auto-Length Moving Average + Trend Signals (Zeiierman) is an easy-to-use indicator designed to help traders dynamically adjust their moving average length based on market conditions. This tool adapts in real-time, expanding and contracting the moving average based on trend strength and momentum shifts.
The indicator smooths out price fluctuations by modifying its length while ensuring responsiveness to new trends. In addition to its adaptive length algorithm, it incorporates trend confirmation signals, helping traders identify potential trend reversals and continuations with greater confidence.
This indicator suits scalpers, swing traders, and trend-following investors who want a self-adjusting moving average that adapts to volatility, momentum, and price action dynamics.
█ How It Works
⚪ Dynamic Moving Average Length
The core feature of this indicator is its ability to automatically adjust the length of the moving average based on trend persistence and market conditions:
Expands in strong trends to reduce noise.
Contracts in choppy or reversing markets for faster reaction.
This allows for a more accurate moving average that aligns with current price dynamics.
⚪ Trend Confirmation & Signals
The indicator includes built-in trend detection logic, classifying trends based on market structure. It evaluates trend strength based on consecutive bars and smooths out transitions between bullish, bearish, and neutral conditions.
Uptrend: Price is persistently above the adjusted moving average.
Downtrend: Price remains below the adjusted moving average.
Neutral: Price fluctuates around the moving average, indicating possible consolidation.
⚪ Adaptive Trend Smoothing
A smoothing factor is applied to enhance trend readability while minimizing excessive lag. This balances reactivity with stability, making it easier to follow longer-term trends while avoiding false signals.
█ How to Use
⚪ Trend Identification
Bullish Trend: The indicator confirms an uptrend when the price consistently stays above the dynamically adjusted moving average.
Bearish Trend: A downtrend is recognized when the price remains below the moving average.
⚪ Trade Entry & Exit
Enter long when the dynamic moving average is green and a trend signal occurs. Exit when the price crosses below the dynamic moving average.
Enter short when the dynamic moving average is red and a trend signal occurs. Exit when the price crosses above the dynamic moving average.
█ Slope-Based Reset
This mode resets the trend counter when the moving average slope changes direction.
⚪ Interpretation & Insights
Best for trend-following traders who want to filter out noise and only reset when a clear shift in momentum occurs.
Higher slope length (N): More stable trends, fewer resets.
Lower slope length (N): More reactive to small price swings, frequent resets.
Useful in swing trading to track significant trend reversals.
█ RSI-Based Reset
The counter resets when the Relative Strength Index (RSI) crosses predefined overbought or oversold levels.
⚪ Interpretation & Insights
Best for reversal traders who look for extreme overbought/oversold conditions.
High RSI threshold (e.g., 80/20): Fewer resets, only extreme conditions trigger adjustments.
Lower RSI threshold (e.g., 60/40): More frequent resets, detecting smaller corrections.
Great for detecting exhaustion in trends before potential reversals.
█ Volume-Based Reset
A reset occurs when current volume significantly exceeds its moving average, signaling a shift in market participation.
⚪ Interpretation & Insights
Best for traders who follow institutional activity (high volume often means large players are active).
Higher volume SMA length: More stable trends, only resets on massive volume spikes.
Lower volume SMA length: More reactive to short-term volume shifts.
Useful in identifying breakout conditions and trend acceleration points.
█ Bollinger Band-Based Reset
A reset occurs when price closes above the upper Bollinger Band or below the lower Bollinger Band, signaling potential overextension.
⚪ Interpretation & Insights
Best for traders looking for volatility-based trend shifts.
Higher Bollinger Band multiplier (k = 2.5+): Captures only major price extremes.
Lower Bollinger Band multiplier (k = 1.5): Resets on moderate volatility changes.
Useful for detecting overextensions in strong trends before potential retracements.
█ MACD-Based Reset
A reset occurs when the MACD line crosses the signal line, indicating a momentum shift.
⚪ Interpretation & Insights
Best for momentum traders looking for trend continuation vs. exhaustion signals.
Longer MACD lengths (260, 120, 90): Captures major trend shifts.
Shorter MACD lengths (10, 5, 3): Reacts quickly to momentum changes.
Useful for detecting strong divergences and market shifts.
█ Stochastic-Based Reset
A reset occurs when Stochastic %K crosses overbought or oversold levels.
⚪ Interpretation & Insights
Best for short-term traders looking for fast momentum shifts.
Longer Stochastic length: Filters out false signals.
Shorter Stochastic length: Captures quick intraday shifts.
█ CCI-Based Reset
A reset occurs when the Commodity Channel Index (CCI) crosses predefined overbought or oversold levels. The CCI measures the price deviation from its statistical mean, making it a useful tool for detecting overextensions in price action.
⚪ Interpretation & Insights
Best for cycle traders who aim to identify overextended price deviations in trending or ranging markets.
Higher CCI threshold (e.g., ±200): Detects extreme overbought/oversold conditions before reversals.
Lower CCI threshold (e.g., ±10): More sensitive to trend shifts, useful for early signal detection.
Ideal for detecting momentum shifts before price reverts to its mean or continues trending strongly.
█ Momentum-Based Reset
A reset occurs when Momentum (Rate of Change) crosses zero, indicating a potential shift in price direction.
⚪ Interpretation & Insights
Best for trend-following traders who want to track acceleration vs. deceleration.
Higher momentum length: Captures longer-term shifts.
Lower momentum length: More responsive to short-term trend changes.
█ How to Interpret the Trend Strength Table
The Trend Strength Table provides valuable insights into the current market conditions by tracking how the dynamic moving average is adjusting based on trend persistence. Each metric in the table plays a role in understanding the strength, longevity, and stability of a trend.
⚪ Counter Value
Represents the current length of trend persistence before a reset occurs.
The higher the counter, the longer the current trend has been in place without resetting.
When this value reaches the Counter Break Threshold, the moving average resets and contracts to become more reactive.
Example:
A low counter value (e.g., 10) suggests a recent trend reset, meaning the market might be changing directions frequently.
A high counter value (e.g., 495) means the trend has been ongoing for a long time, indicating strong trend persistence.
⚪ Trend Strength
Measures how strong the current trend is based on the trend confirmation logic.
Higher values indicate stronger trends, while lower values suggest weaker trends or consolidations.
This value is dynamic and updates based on price action.
Example:
Trend Strength of 760 → Indicates a high-confidence trend.
Trend Strength of 50 → Suggests weak price action, possibly a choppy market.
⚪ Highest Trend Score
Tracks the strongest trend score recorded during the session.
Helps traders identify the most dominant trend observed in the timeframe.
This metric is useful for analyzing historical trend strength and comparing it with current conditions.
Example:
Highest Trend Score = 760 → Suggests that at some point, there was a strong trend in play.
If the current trend strength is much lower than this value, it could indicate trend exhaustion.
⚪ Average Trend Score
This is a rolling average of trend strength across the session.
Provides a bigger picture of how the trend strength fluctuates over time.
If the average trend score is high, the market has had persistent trends.
If it's low, the market may have been choppy or sideways.
Example:
Average Trend Score of 147 vs. Current Trend Strength of 760 → Indicates that the current trend is significantly stronger than the historical average, meaning a breakout might be occurring.
Average Trend Score of 700+ → Suggests a strong trending market overall.
█ Settings
⚪ Dynamic MA Controls
Base MA Length – Sets the starting length of the moving average before dynamic adjustments.
Max Dynamic Length – Defines the upper limit for how much the moving average can expand.
Trend Confirmation Length – The number of bars required to validate an uptrend or downtrend.
⚪ Reset & Adaptive Conditions
Reset Condition Type – Choose what triggers the moving average reset (Slope, RSI, Volume, MACD, etc.).
Trend Smoothing Factor – Adjusts how smoothly the moving average responds to price changes.
-----------------
Disclaimer
The content provided in my scripts, indicators, ideas, algorithms, and systems is for educational and informational purposes only. It does not constitute financial advice, investment recommendations, or a solicitation to buy or sell any financial instruments. I will not accept liability for any loss or damage, including without limitation any loss of profit, which may arise directly or indirectly from the use of or reliance on such information.
All investments involve risk, and the past performance of a security, industry, sector, market, financial product, trading strategy, backtest, or individual's trading does not guarantee future results or returns. Investors are fully responsible for any investment decisions they make. Such decisions should be based solely on an evaluation of their financial circumstances, investment objectives, risk tolerance, and liquidity needs.

Money Flow ExtendedMoney Flow Extended (MF)
Definition
The Money Flow Extended (MF) indicator brings together the functionality of the Money Flow Index indicator (MFI) , a tool created by Gene Quong and Avrum Soudack and used in technical analysis for measuring buying and selling pressure, and The Relative Strength Index (RSI) , a well versed momentum based oscillator created by J.Welles Wilder Jr., which is used to measure the speed (velocity) as well as the change (magnitude) of directional price movements.
History
As the Money Flow Index (MFI) is quite similar to The Relative Strength Index (RSI), essentially the RSI with the added aspect of volume, adding a Moving Average, divergence calculation, oversold and overbought gradients, facilitates the transition from RSI, making the use of MFI pretty similar.
What to look for
Overbought/Oversold
When momentum and price rise fast enough, at a high enough level, eventual the security will be considered overbought. The opposite is also true. When price and momentum fall far enough, they can be considered oversold. Traditional overbought territory starts above 80 and oversold territory starts below 20. These values are subjective however, and a technical analyst can set whichever thresholds they choose.
Divergence
MF Divergence occurs when there is a difference between what the price action is indicating and what MF is indicating. These differences can be interpreted as an impending reversal. Specifically, there are two types of divergences, bearish and bullish.
Bullish MFI Divergence – When price makes a new low but MF makes a higher low.
Bearish MFI Divergence – When price makes a new high but MF makes a lower high.
Failure Swings
Failure swings are another occurrence which can lead to a price reversal. One thing to keep in mind about failure swings is that they are completely independent of price and rely solely on MF. Failure swings consist of four steps and are considered to be either Bullish (buying opportunity) or Bearish (selling opportunity).
Bullish Failure Swing
MF drops below 20 (considered oversold).
MF bounces back above 20.
MF pulls back but remains above 20 (remains above oversold)
MF breaks out above its previous high.
Bearish Failure Swing
MF rises above 80 (considered overbought)
MF drops back below 80
MF rises slightly but remains below 80 (remains below overbought)
MF drops lower than its previous low.
Summary
The Money Flow Extended (MF) can be a very valuable technical analysis tool. Of course, MF should not be used alone as the sole source for a trader’s signals or setups. MF can be combined with additional indicators or chart pattern analysis to increase its effectiveness.
Inputs
Length
The time period to be used in calculating the MF. 14 is the default.
Pivot Loopback
After how many bars you want the divergence to show, on the scale of 1-5. 5 is the default.
Calculate Divergence
Calculating divergences is needed in order for divergence alerts to fire.
Moving Average section
You can learn more about the inputs in the "Moving Average" section in this Help Center article .
Style
MF
Can toggle the visibility of the MF as well as the visibility of a price line showing the actual current value of the MF. Can also select the MF Line's color, line thickness and visual style.
MF-based MA
Can toggle the visibility of the MF-based MA as well as the visibility of a price line showing the actual current MA value. Can also select its color, line thickness and line style.
MF Upper Band
Can toggle the visibility of the Upper Band as well as sets the boundary, on the scale of 1-100, for the Upper Band (80 is the default). The color, line thickness and line style can also be determined.
MF Middle Band
Can toggle the visibility of the Middle Band as well as sets the boundary, on the scale of 1-100, for the Middle Band (50 is the default). The color, line thickness and line style can also be determined.
MF Lower Band
Can toggle the visibility of the Lower Band as well as sets the boundary, on the scale of 1-100, for the Lower Band (20 is the default). The color, line thickness and line style can also be determined.
MF Background Fill
Toggles the visibility of a Background color within the MF's boundaries. Can also change the Color itself as well as the opacity.
Overbought Gradient Fill
Can toggle the visibility of the Overbought Gradient Fill. Can also select its colors combination.
Oversold Gradient Fill
Can toggle the visibility of the Oversold Gradient Fill. Can also select its colors combination.
Precision
Sets the number of decimal places to be left on the indicator's value before rounding up. The higher this number, the more decimal points will be on the indicator's value.

RSI and Dev Advanced Volatility IndexEnglish Explanation of the "RSI and Dev Advanced Volatility Index" Pine Script Code
Understanding the Code
Purpose:
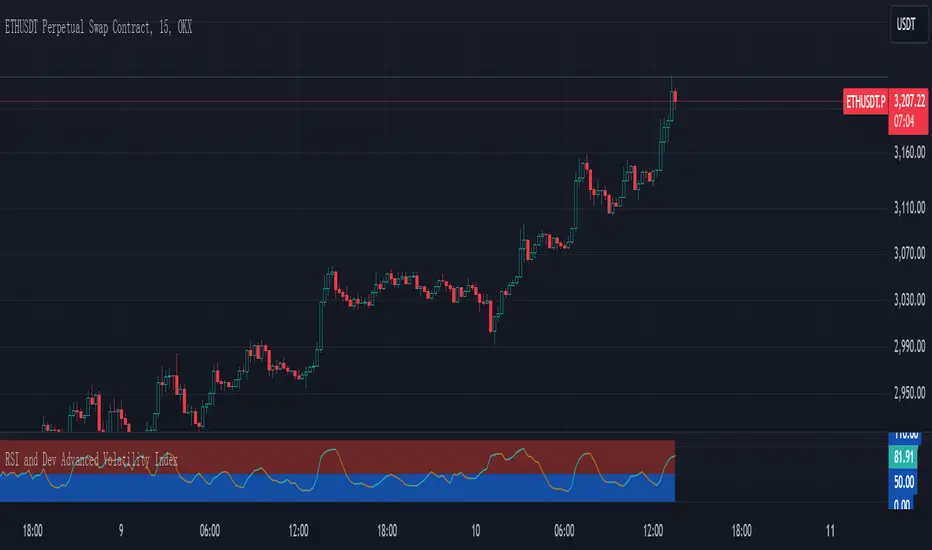
This Pine Script code creates a custom indicator that combines the Relative Strength Index (RSI) and Deviation (DEV) to provide insights into market volatility.
Key Components:
* Deviation (DEV): Calculates the difference between the closing price and the 10-period simple moving average. This measures the extent to which the price deviates from its recent average, indicating volatility.
* RSI: The traditional RSI is then applied to the calculated deviations. This helps to smooth the data and identify overbought or oversold conditions in terms of volatility.
Calculation Steps:
* Deviation Calculation: The difference between the closing price and its 10-period simple moving average is calculated.
* RSI Calculation: The RSI is calculated on the deviations, providing a measure of the speed and change of volatility relative to recent volatility changes.
* Plotting:
* The RSI of the deviations is plotted on the chart.
* Horizontal lines are plotted at 50, 0, and 110 to visually represent different volatility zones.
* The area between the lines is filled with color to highlight low and high volatility regions.
Interpretation and Usage
* Volatility Analysis:
* High Volatility: When the RSI is above 50, it indicates high volatility, suggesting the market might be in a consolidation or trend reversal phase.
* Low Volatility: When the RSI is below 50, it indicates low volatility, suggesting a relatively calm market.
* Trading Signals:
* Buy Signal: When the RSI crosses above 50 from below, it might signal increasing volatility, which could be a buying opportunity.
* Sell Signal: When the RSI crosses below 50 from above, it might signal decreasing volatility, which could be a selling opportunity.
* Risk Management:
* By monitoring volatility, traders can better manage their risk. During periods of high volatility, traders might reduce their position size or adopt more conservative strategies.
Advantages
* Comprehensive: Combines RSI and DEV for a more holistic view of volatility.
* Sensitivity: Quickly responds to changes in market volatility.
* Visual Clarity: Color-coded zones provide a clear visual representation of different volatility levels.
Limitations
* Parameter Sensitivity: The indicator's performance is sensitive to parameter changes, such as the lookback period for the moving average.
* Lag: Like most technical indicators, it has some lag and might not capture every market movement.
* Not Predictive: It can only indicate current and past volatility, not future movements.
Summary
This custom indicator offers a valuable tool for analyzing market volatility. By combining RSI and DEV, it provides a more nuanced perspective on price fluctuations. However, it should be used in conjunction with other technical indicators and fundamental analysis for more robust trading decisions.
Key points to remember:
* Higher RSI values indicate higher volatility.
* Lower RSI values indicate lower volatility.
* Crossovers of the RSI line above or below 50 can provide potential trading signals.
* The indicator should be used in conjunction with other analysis tools for a more complete picture of the market.
XAUUSD Multi-Timeframe Trend AnalyzerOverview
The "XAUUSD Multi-Timeframe Trend Analyzer" is an advanced script designed to provide a comprehensive analysis of the XAUUSD (Gold/US Dollar) trend across multiple timeframes simultaneously. By combining several key technical indicators, this tool helps traders quickly assess the market direction and trend strength for M15, M30, H1, H4, and D1 timeframes.
Multi-Timeframe Analysis: Displays the trend direction and strength across M15, M30, H1, H4, and D1 timeframes, allowing for a complete overview in a single glance.
Comprehensive Indicator Blend: Utilizes six popular technical indicators to determine the trend—Moving Averages, RSI, MACD, Bollinger Bands, DMI, and Parabolic SAR.
Trend Strength Scoring: Provides a numerical trend strength score (from -6 to 6) based on the alignment of the indicators, with positive values indicating uptrends and negative values for downtrends.
Visual Table Display: Displays results in a color-coded table (green for uptrend, red for downtrend, yellow for neutral) with a strength score for each timeframe, helping traders quickly assess market conditions.
How It Works
This script calculates the overall trend and its strength for each selected timeframe by analyzing six widely-used technical indicators:
Moving Averages (MA): The script uses a Fast and a Slow Moving Average. When the Fast MA crosses above the Slow MA, it indicates an uptrend. When the Fast MA crosses below, it signals a downtrend.
Relative Strength Index (RSI): The RSI is used to assess momentum. An RSI value above 50 suggests bullish momentum, while a value below 50 suggests bearish momentum.
Moving Average Convergence Divergence (MACD): MACD measures momentum and trend direction. When the MACD line crosses above the signal line, it signals bullish momentum; when it crosses below, it signals bearish momentum.
Bollinger Bands: These measure price volatility. When the price is above the middle Bollinger Band, the script considers the trend to be bullish, and when it's below, bearish.
Directional Movement Index (DMI): The DMI compares positive directional movement (DI+) and negative directional movement (DI-). A stronger DI+ over DI- signals an uptrend and vice versa.
Parabolic SAR: This indicator is used for determining potential trend reversals and setting stop-loss levels. If the price is above the Parabolic SAR, it indicates an uptrend, and if below, a downtrend.
Trend Strength Calculation
The script calculates a trend strength score for each timeframe:
Each indicator adds or subtracts 1 to the score based on whether it aligns with an uptrend or a downtrend.
A score of 6 indicates a Strong Uptrend, with all indicators aligned bullishly.
A score of -6 indicates a Strong Downtrend, with all indicators aligned bearishly.
Intermediate scores (e.g., 2 or -2) indicate Weak Uptrend or Weak Downtrend, suggesting that not all indicators are in agreement.
A score between 1 and -1 indicates a Neutral trend, suggesting uncertainty in the market.
How to Use
Assess Trend Direction and Strength: The table provides an easy-to-read summary of the trend and its strength on different timeframes. Look for timeframes where the strength is high (either 6 for a strong uptrend or -6 for a strong downtrend) to confirm the market’s overall direction.
Use in Conjunction with Other Strategies: This indicator is designed to provide a comprehensive view of the market. Traders should combine it with other strategies, such as price action analysis or candlestick patterns, to further confirm their trades.
Trend Reversal or Continuation: A weak trend (e.g., a strength of 2 or -2) could signal a possible reversal or a trend that has lost momentum. Strong trends (with a strength of 6 or -6) indicate higher confidence in trend continuation.
Multiple Timeframe Confirmation: Look for alignment across multiple timeframes to confirm the strength and direction of the trend before entering trades. For example, if M15, M30, and H1 are all showing a strong uptrend, it suggests a higher probability of the trend continuing.
Customization Options
- Adjustable Indicators: Users can modify the length and parameters of the Moving Averages, RSI, MACD, Bollinger Bands, DMI, and Parabolic SAR to suit their trading style.
- Flexible Timeframes: You can toggle between different timeframes (M15, M30, H1, H4, D1) to focus on the intervals most relevant to your strategy.
Ideal For
- Traders looking for a detailed, multi-timeframe trend analysis tool for XAUUSD.
- Traders who rely on trend-following strategies and need confirmation across multiple timeframes.
- Those who prefer a multi-indicator approach to avoid false signals and improve the accuracy of their trades.
Disclaimer
This indicator is for informational and educational purposes only. It is recommended to combine this with proper risk management strategies and your own analysis. Past performance does not guarantee future results. Always perform your own due diligence before making trading decisions.

RSI Standard Deviation | viResearchRSI Standard Deviation | viResearch
The "RSI Standard Deviation" indicator, developed by viResearch, introduces a new approach to combining the Relative Strength Index (RSI) with a standard deviation measure to offer a more dynamic view of market momentum. By applying standard deviation to the RSI values, this indicator refines the traditional RSI, providing a more precise and adaptive way to measure overbought and oversold conditions. This unique combination allows traders to better understand the underlying volatility in RSI movements, leading to more informed decisions in trending and ranging markets.
Technical Composition and Calculation:
The core of the "RSI Standard Deviation" lies in calculating the RSI based on user-defined input parameters and then applying standard deviation to these RSI values. This method enhances the sensitivity of the RSI, making it more responsive to market volatility.
RSI Calculation:
RSI Length (len): The script computes the Relative Strength Index over a customizable length (default: 21), offering a traditional measure of momentum in the market. The RSI tracks the speed and change of price movements, oscillating between 0 and 100 to indicate overbought and oversold conditions.
Standard Deviation Applied to RSI:
Standard Deviation Length (sdlen): The script calculates the standard deviation of the RSI values over a user-defined period (default: 35). This standard deviation represents the volatility in RSI movements, adding a new layer of analysis to traditional RSI.
Upper (u) and Lower (d) Bands:
The standard deviation values are used to create upper and lower bands around the RSI, offering an adaptive range that expands or contracts based on market volatility. This helps traders identify moments when the market is more likely to reverse or continue its trend.
Trend Identification:
Uptrend (L): The script identifies an uptrend when the RSI moves above the lower band and stays above the midline (50). This indicates that the market is gaining upward momentum, potentially signaling a long position.
Downtrend (S): A downtrend is identified when the RSI moves below 50, suggesting a weakening market and a potential short position.
Features and User Inputs:
The "RSI Standard Deviation" script offers various customization options, enabling traders to tailor it to their specific needs and strategies:
RSI Length: Traders can adjust the length of the RSI calculation to control how quickly the indicator responds to price movements.
Standard Deviation Length: Adjusting the standard deviation length allows users to control the sensitivity of the upper and lower bands, fine-tuning the indicator’s responsiveness to market volatility.
Source Input: The script can be applied to different price sources, offering flexibility in how it calculates RSI and standard deviation values.
Practical Applications:
The "RSI Standard Deviation" indicator is particularly useful in volatile markets, where traditional RSI may produce false signals due to rapid price movements. By adding a standard deviation measure, traders can filter out noise and better identify trends.
Key Uses:
Trend Following: The standard deviation bands provide a clearer view of momentum shifts in the RSI, allowing traders to follow the trend more confidently.
Volatility Assessment: The indicator dynamically adjusts to market volatility, making it easier to assess when the market is overbought or oversold and when a trend reversal is likely.
Signal Confirmation: By comparing the RSI to the adaptive standard deviation bands, traders can confirm signals and avoid false entries during periods of high volatility.
Advantages and Strategic Value:
The "RSI Standard Deviation" offers several advantages:
Enhanced Precision: The combination of RSI and standard deviation results in a more refined momentum indicator that adapts to market conditions.
Noise Reduction: The standard deviation bands help filter out short-term market noise, making it easier to identify significant trend changes.
Dynamic Volatility Awareness: By using standard deviation, the indicator adjusts its bands based on real-time volatility, providing more accurate overbought and oversold signals.
Summary and Usage Tips:
The "RSI Standard Deviation" is a powerful tool for traders looking to enhance their RSI analysis with volatility measures. For optimal performance, traders should experiment with different RSI and standard deviation lengths to suit their trading timeframe and strategy. Whether used to follow trends or confirm momentum signals, the "RSI Standard Deviation" provides a reliable and adaptive solution for modern trading environments.

VWAP with RSIVWAP with RSI Indicator
Overview
The VWAP with RSI Indicator is a powerful tool that combines the Volume Weighted Average Price (VWAP) with the Relative Strength Index (RSI) to provide traders with comprehensive insights into price trends, volume-weighted price levels, and market momentum. This dual-indicator setup enhances your trading strategy by offering a clearer understanding of the market conditions, potential entry and exit points, and trend reversals.
Key Features
VWAP (Volume Weighted Average Price):
Calculation: The VWAP is calculated using the high, low, and close prices, weighted by trading volume over a specified period.
Purpose: VWAP provides an average price that reflects the trading volume at different price levels, helping traders identify the true average price over a given period.
Visualization: The VWAP line is plotted in blue on the price chart, indicating the volume-weighted average price.
RSI (Relative Strength Index):
Calculation: RSI is based on the average gains and losses over a specified period (default is 14 periods) and ranges from 0 to 100.
Purpose: RSI measures the speed and change of price movements, identifying overbought or oversold conditions in the market.
Overbought/Oversold Levels:
Overbought: RSI above 70 (red line).
Oversold: RSI below 30 (green line).
Midline: RSI at 50 (gray dashed line).
Visualization: The RSI line changes color based on its value (purple for normal, red for overbought, green for oversold) and is plotted below the price chart.
Background Fill for RSI:
Overbought Area: Shaded red when RSI is above 70.
Oversold Area: Shaded green when RSI is below 30.
Bullish and Bearish Divergence Detection:
Bullish Divergence: Occurs when price forms a lower low, but RSI forms a higher low, indicating potential upward reversal.
Visualization: Bullish divergence points are marked with a green line and labeled "Bull."
Bearish Divergence: Occurs when price forms a higher high, but RSI forms a lower high, indicating potential downward reversal.
Visualization: Bearish divergence points are marked with a red line and labeled "Bear."
Alerts: Conditions for bullish and bearish divergences trigger alerts.
Settings
VWAP Settings:
hideonDWM: Option to hide VWAP on daily or higher timeframes.
src: Source for VWAP calculation (default is hlc3 - (high + low + close)/3).
offset: Offset for plotting the VWAP.
RSI Settings:
rsiLengthInput: Period length for RSI calculation (default is 14).
rsiSourceInput: Source for RSI calculation (default is close price).
maTypeInput: Type of moving average applied to RSI (options: SMA, EMA).
maLengthInput: Length of the moving average applied to RSI.
How to Use
Trend Identification: Use VWAP to identify the average price level and market trend. If the price is above VWAP, it suggests an uptrend, and if below, it suggests a downtrend.
Overbought/Oversold Conditions: Use RSI to identify potential reversal points. RSI above 70 indicates overbought conditions, and below 30 indicates oversold conditions.
Divergence: Look for bullish or bearish divergences between price and RSI to anticipate potential trend reversals.
Conclusion
By combining VWAP and RSI, this indicator provides a robust framework for analyzing market conditions, identifying trends, and making more informed trading decisions. Enhance your trading strategy today with the VWAP with RSI Indicator!

RSI Analysis with Statistical Summary Scientific Analysis of the Script "RSI Analysis with Statistical Summary"
Introduction
I observed that there are outliers in the price movement liquidity, and I wanted to understand the RSI value at those points and whether there are any notable patterns. I aimed to analyze this statistically, and this script is the result.
Explanation of Key Terms
1. Outliers in Price Movement Liquidity: An outlier is a data point that significantly deviates from other values. In this context, an outlier refers to an unusually high or low liquidity of price movement, which is the ratio of trading volume to the price difference between the open and close prices. These outliers can signal important market changes or unusual trading activities.
2. RSI (Relative Strength Index): The RSI is a technical indicator that measures the speed and change of price movements. It ranges from 0 to 100 and helps identify overbought or oversold conditions of a trading instrument. An RSI value above 70 indicates an overbought condition, while a value below 30 suggests an oversold condition.
3. Mean: The mean is a measure of the average of a dataset. It is calculated by dividing the sum of all values by the number of values. In this script, the mean of the RSI values is calculated to provide a central tendency of the RSI distribution.
4. Standard Deviation (stdev): The standard deviation is a measure of the dispersion or variation of a dataset. It shows how much the values deviate from the mean. A high standard deviation indicates that the values are widely spread, while a low standard deviation indicates that the values are close to the mean.
5. 68% Confidence Interval: A confidence interval indicates the range within which a certain percentage of values of a dataset lies. The 68% confidence interval corresponds to a range of plus/minus one standard deviation around the mean. It indicates that about 68% of the data points lie within this range, providing insight into the distribution of values.
Overview
This Pine Script™, written in Pine version 5, is designed to analyze the Relative Strength Index (RSI) of a stock or other trading instrument and create statistical summaries of the distribution of RSI values. The script identifies outliers in price movement liquidity and uses this information to calculate the frequency of RSI values. At the end, it displays a statistical summary in the form of a table.
Structure and Functionality of the Script
1. Input Parameters
- `rsi_len`: An integer input parameter that defines the length of the RSI (default: 14).
- `outlierThreshold`: An integer input parameter that defines the length of the outlier threshold (default: 10).
2. Calculating Price Movement Liquidity
- `priceMovementLiquidity`: The volume is divided by the absolute difference between the close and open prices to calculate the liquidity of the price movement.
3. Determining the Boundary for Liquidity and Identifying Outliers
- `liquidityBoundary`: The boundary is calculated using the Exponential Moving Average (EMA) of the price movement liquidity and its standard deviation.
- `outlier`: A boolean value that indicates whether the price movement liquidity exceeds the set boundary.
4. Calculating the RSI
- `rsi`: The RSI is calculated with a period length of 14, using various moving averages (e.g., SMA, EMA) depending on the settings.
5. Storing and Limiting RSI Values
- An array `rsiFrequency` stores the frequency of RSI values from 0 to 100.
- The function `f_limit_rsi` limits the RSI values between 0 and 100.
6. Updating RSI Frequency on Outlier Occurrence
- On an outlier occurrence, the limited and rounded RSI value is updated in the `rsiFrequency` array.
7. Statistical Summary
- Various variables (`mostFrequentRsi`, `leastFrequentRsi`, `maxCount`, `minCount`, `sum`, `sumSq`, `count`, `upper_interval`, `lower_interval`) are initialized to perform statistical analysis.
- At the last bar (`bar_index == last_bar_index`), a loop is run to determine the most and least frequent RSI values and their frequencies. Sum and sum of squares of RSI values are also updated for calculating mean and standard deviation.
- The mean (`mean`) and standard deviation (`stddev`) are calculated. Additionally, a 68% confidence interval is determined.
8. Creating a Table for Result Display
- A table `resultsTable` is created and filled with the results of the statistical analysis. The table includes the most and least frequent RSI values, the standard deviation, and the 68% confidence interval.
9. Graphical Representation
- The script draws horizontal lines and fills to indicate overbought and oversold regions of the RSI.
Interpretation of the Results
The script provides a detailed analysis of RSI values based on specific liquidity outliers. By calculating the most and least frequent RSI values, standard deviation, and confidence interval, it offers a comprehensive statistical summary that can help traders identify patterns and anomalies in the RSI. This can be particularly useful for identifying overbought or oversold conditions of a trading instrument and making informed trading decisions.
Critical Evaluation
1. Robustness of Outlier Identification: The method of identifying outliers is solely based on the liquidity of price movement. It would be interesting to examine whether other methods or additional criteria for outlier identification would lead to similar or improved results.
2. Flexibility of RSI Settings: The ability to select various moving averages and period lengths for the RSI enhances the adaptability of the script, allowing users to tailor it to their specific trading strategies.
3. Visualization of Results: While the tabular representation is useful, additional graphical visualizations, such as histograms of RSI distribution, could further facilitate the interpretation of the results.
In conclusion, this script provides a solid foundation for analyzing RSI values by considering liquidity outliers and enables detailed statistical evaluation that can be beneficial for various trading strategies.

Zaree - RSI Gradient FillDescription:
The "Zaree - RSI Gradient Fill" (RGF) indicator is a technical analysis tool designed to enhance the interpretation of the Relative Strength Index (RSI) by incorporating visual cues through gradient fill. This indicator aids traders in identifying potential overbought and oversold conditions in the market using the RSI as a key reference.
Details of the Indicator:
The indicator calculates the RSI of a selected source based on user-defined settings for length and source.
Traders have the option to choose from various types of moving averages (SMA, EMA, SMMA, WMA) to calculate the RSI.
RSI values and their corresponding moving average values are plotted on the chart for visual analysis.
The indicator offers customization through input settings for RSI length, RSI source, and moving average type and length.
Upper and lower bands for the RSI are displayed on the chart, providing visual cues for potential overbought and oversold conditions.
A center line is plotted on the chart to help traders identify the equilibrium point of the RSI.
The gradient fill feature enhances the visualization by coloring the space between the RSI plot and the center line based on RSI levels.
How to Use the Indicator:
Specify the RSI length and source for calculation.
Choose the desired moving average type and set the length for the moving average.
Observe the RSI values, moving average lines, and the center line plotted on the chart.
Pay attention to the position of the RSI values relative to the upper and lower bands. Values above the upper band suggest potential overbought conditions, while values below the lower band indicate potential oversold conditions.
Interpret the gradient fill between the RSI plot and the center line. The color changes provide additional visual cues about the RSI's strength compared to the center line.
Example of Usage:
As an experienced swing trader, you can leverage the RGF indicator to fine-tune your trading decisions. Here's an example of how you might use the indicator:
Select your preferred RSI length and source, such as the closing price.
Choose "SMA" as the moving average type and set the length to 14.
Observe the RSI values plotted on the chart along with the upper and lower bands.
Pay special attention to the gradient fill between the RSI plot and the center line. This coloring offers valuable insights into the RSI's position relative to equilibrium.
Look for instances where the RSI values cross above or below the upper and lower bands. These crossings can signal potential trend shifts or reversals.
Use the gradient fill colors to quickly assess the strength of the RSI's deviation from the center line.
Remember that the RGF indicator is a powerful tool to complement your trading strategy. Consider combining its insights with other technical and fundamental analyses for well-informed trading decisions.
Feel free to adjust the indicator settings according to your trading preferences and style. While the RGF indicator provides valuable visual cues, always consider the broader context of the market before making trading choices.

RSI Primed [ChartPrime]
RSI Primed combines candlesticks, patterns, and the classic RSI indicator for advanced market trend indications
Introduction
Technical traders are always looking for innovative methods to pinpoint potential entry and exit points in the market. The RSI Prime indicator provides such traders with an enhanced view of market conditions by combining various charting styles and the Relative Strength Index (RSI). It offers users a unique perspective on the market trends and price momentum, enabling them to make better-informed decisions and stay ahead of the market curve.
The RSI Primed is a versatile indicator that combines different charting styles with the Relative Strength Index (RSI) to help traders analyze market trends and price momentum. It offers multiple visualization modes that serve specific purposes and provide unique insights into market performance:
Regular Candlesticks
Candlesticks with Patterns
Heikin Ashi Candles
Line Style
Regular Candlestick Mode
The Regular Candlestick Mode in RSI Primed depicts traditional Japanese candlesticks that most traders are familiar with. This mode bypasses any smoothing or modified calculations, representing real-price movements. Regular candlesticks offer a clear and straightforward way to visualize market trends and price action.
Candlestick with Patterns Mode
The Candlestick with Patterns Mode focuses on identifying high-probability candlestick patterns while incorporating RSI values. By leveraging the information captured by the RSI, this mode allows traders to spot significant market reversals or continuation patterns that could signal potential trading opportunities. Some recognizable patterns include engulfing bullish, engulfing bearish, morning star bullish, and evening star bearish patterns.
Heikin Ashi Candles Mode
The Heikin Ashi Candles Mode presents an advanced candlestick charting technique known for its excellent trend-following capabilities. Heikin Ashi Candles filter out noise in the market and provide a clear representation of market trends. In this mode, candlesticks are plotted based on RSI values of the open, high, low, and close prices, helping traders understand and utilize market trends effectively.
Line Style Mode
The Line Style Mode offers a simpler and minimalistic representation of the RSI values by using a line instead of candlesticks to visualize market trends. This mode helps traders focus on the overall trend direction and eliminates potential distractions caused by the complexity of candlestick patterns.
Candle Color Overlay Mode
The Candle Color Overlay Mode is a unique feature in the RSI Primed indicator that allows traders to visualize the RSI values on the chart's candles as a heat gradient. This mode adds a color overlay to the candlesticks, representing the RSI values in relation to the candlesticks' price action.
By displaying the RSI as a color gradient, traders can quickly assess market momentum and identify overbought or oversold conditions without having to switch between different modes or charts. The gradient ranges from cool colors (blue and green) for lower RSI values, indicating oversold conditions, to warm colors (orange and red) for higher RSI values, signifying overbought situations.
To enable the Candle Color Overlay Mode, traders can toggle the "Color Candles" option in the indicator settings. Once enabled, the color gradient will be applied to the candlesticks on the chart, providing a visually striking and informative representation of the RSI values in relation to price action. This mode can be used in tandem with any of the other charting styles, allowing traders to gain even more insights into market trends and momentum.
RSI Primed Implementation
The RSI Primed indicator combines the benefits of various charting styles with the RSI to help traders gain a comprehensive view of market trends and price momentum. It incorporates the Heikin Ashi and RSI values as inputs to generate several visualization modes, enabling traders to select the one that best suits their needs.
Chebyshev Digital Audio Filter in RSI Primed Indicator
A unique feature of the RSI Primed Indicator is the incorporation of the Chebyshev Digital Audio Filter, a powerful tool that significantly influences the indicator's accuracy and responsiveness. This signal processing method brings several benefits to the context of the RSI indicator, improving its performance and capabilities.
1. Improved Signal Filtering
The Chebyshev filter excels in its ability to remove high-frequency noise and unwanted signals from the RSI data. While other filtering techniques might introduce unwanted side effects or distort the RSI data, the Chebyshev filter accurately retains the main signal components, enhancing the RSI Primed's overall accuracy and reliability.
2. Faster Response Time
The Chebyshev filter offers a faster response time than most other filtering techniques. In the context of the RSI Primed Indicator, this means that the filtering process is quicker and more efficient, allowing traders to act swiftly during rapidly changing market conditions.
3. Enhanced Trend Detection
By effectively removing noise from the RSI data, the Chebyshev filter contributes to the enhanced detection of underlying market trends. This feature helps traders identify potential entry and exit points more accurately, improving their overall trading strategy and performance.
How to Use RSI Primed
Traders can choose from different visualization modes to suit their preferences while using the RSI Primed indicator. By closely monitoring the chosen visualization mode and the position of the moving average, traders can make informed decisions about market trends.
Green candlesticks or an upward line slope indicate a bullish trend, and red candlesticks or a downward line slope suggest a bearish trend. If the candles or line are above the moving average, it could signify an uptrend, whereas a position below the moving average may indicate a downtrend.
The RSI Primed indicator offers a unique and comprehensive perspective on market trends and price momentum by combining various charting styles with the RSI. Traders can choose from different visualization modes and make well-informed decisions to capitalize on market opportunities. This innovative indicator provides a clear and concise view of the market, enabling traders to make swift decisions and enhance their trading results.

RF+ Divergence Scalping SystemRF+ Divergence Scalping System + Custom Signals + Alerts.
This chart overlay indicator has been developed for the low timeframe divergence scalper.
Built upon the realtime divergence drawing code from the Divergence for Many indicator originally authored by Lonsometheblue, this chart overlay indicator bundles several additional unique features and modifications to serve as an all-in-one divergence scalping system. The current key features at the time of publishing are listed below (features are optional and can be enabled or disabled):
- Fully configurable realtime divergence drawing and alerting feature that can draw divergences directly on the chart using data sourced from up to 11 oscillators selected by the user, which have been included specifically for their ability to detect divergences, including oscillators not presently included in the original Divergence for Many indicator, such as the Ultimate Oscillator and TSI.
- Optional on chart table showing a summary of key statuses of various indicators, and nearby divergences.
- 2 x Range Filters with custom settings used for low timeframe trend detection.
- 3 x configurable multi-timeframe Stochastic RSI overbought and oversold signals with presentation options.
- On-chart pivot points drawn automatically.
- Automatically adjusted pivot period for up to 4 configurable time frames to fine tune divergences drawn for optimal divergence detection.
- Real-price line for use with Heikin Ashi candles, with styling options.
- Real-price close dots for use with Heikin Ashi candles, with styling options.
- A selection of custom signals that can be printed on-chart and alerted.
- Sessions indicator for the London, New York, Tokyo and Sydney trading sessions, including daylight savings toggle, and unique ‘invert background color’ option, which colours the entire chart - except the trading session you have selected, leaving your chart clear of distracting background color.
- Up to 4 fully configurable moving averages.
- Additional configurable settings for numerous built in indicators, allowing you to alter the lengths and source types, including the UO, TSI, MFI, TSV, 2 x Range Filters.
- Configurable RSI Trend detection signal filter used in a number of the signals, which filters buy signals where the RSI is over the RSI moving average, and only prints sell signals where RSI is under the moving average.
- Customisable on-chart watermark, with inputs for a custom title, subtitle, and also an optional symbol | timeframe | date feature.
The Oscillators able to be selected for use in drawing divergences at the time of publishing are as follows:
- Ultimate Oscillator (UO)
- True Strength Indicator (TSI)
- Money Flow Index (MFI)
- Cumulative Delta Volume (CDV)
- Time Segmented Volume (TSV)
- Commodity Channel Index (CCI)
- Awesome Oscillator
- Relative Strength Index (RSI)
- Stochastic
- On Balance Volume (OBV)
- MACD Histogram
What are divergences?
Divergence is when the price of an asset is moving in the opposite direction of a technical indicator, such as an oscillator, or is moving contrary to other data. Divergence warns that the current price trend may be weakening, and in some cases may lead to the price changing direction.
There are 4 main types of divergence, which are split into 2 categories;
regular divergences and hidden divergences. Regular divergences indicate possible trend reversals, and hidden divergences indicate possible trend continuation.
Regular bullish divergence: An indication of a potential trend reversal, from the current downtrend, to an uptrend.
Regular bearish divergence: An indication of a potential trend reversal, from the current uptrend, to a downtrend.
Hidden bullish divergence: An indication of a potential uptrend continuation.
Hidden bearish divergence: An indication of a potential downtrend continuation.
Setting alerts.
With this indicator you can set alerts to notify you when any/all of the above types of divergences occur, on any chart timeframe you choose, also when the triple timeframe Stochastic RSI overbought and oversold confluences occur, as well as when custom signals are printed.
Configurable pivot period values.
You can adjust the default pivot period values to suit your prefered trading style and timeframe. If you like to trade a shorter time frame, lowering the default lookback values will make the divergences drawn more sensitive to short term price action. By default, this indicator has enabled the automatic adjustment of the pivot periods for 4 configurable time frames, in a bid to optimize the divergences drawn when the indicator is loaded onto any of the 4 time frames selected. These time frames and their associated pivot periods can be fully reconfigured within the settings menu. By default, these have been further optimized for the low timeframe scalper trading on the 1-15 minute time frames.
How do traders use divergences in their trading?
A divergence is considered a leading indicator in technical analysis , meaning it has the ability to indicate a potential price move in the short term future.
Hidden bullish and hidden bearish divergences, which indicate a potential continuation of the current trend are sometimes considered a good place for traders to begin, since trend continuation occurs more frequently than reversals, or trend changes.
When trading regular bullish divergences and regular bearish divergences, which are indications of a trend reversal, the probability of it doing so may increase when these occur at a strong support or resistance level . A common mistake new traders make is to get into a regular divergence trade too early, assuming it will immediately reverse, but these can continue to form for some time before the trend eventually changes, by using forms of support or resistance as an added confluence, such as when price reaches a moving average, the success rate when trading these patterns may increase.
Typically, traders will manually draw lines across the swing highs and swing lows of both the price chart and the oscillator to see whether they appear to present a divergence, this indicator will draw them for you, quickly and clearly, and can notify you when they occur.
How do traders use overbought and oversold levels in their trading?
The oversold level is when the Stochastic RSI is above the 80 level is typically interpreted as being 'overbought', and below the 20 level is typically considered 'oversold'. Traders will often use the Stochastic RSI at, or crossing down from an overbought level as a confluence for entry into a short position, and the Stochastic RSI at, or crossing up from an oversold level as a confluence for an entry into a long position. These levels do not mean that price will necessarily reverse at those levels in a reliable way, however. This is why this version of the Stoch RSI employs the triple timeframe overbought and oversold confluence, in an attempt to add a more confluence and reliability to this usage of the Stoch RSI.
This indicator is intended for use in conjunction with related panel indicators including the TSI+ (True Strength Indicator + Realtime Divergences), UO+ (Ultimate Oscillator + Realtime Divergences), and optionally the STRSI+ (MTF Stochastic RSI + Realtime Divergences) and MFI+ (Money Flow Index + Realtime Divergences) available via this authors’ Tradingview profile, under the scripts section. The realtime divergence drawing code will not identify all divergences, so it is suggested that you also have panel indicators to observe. Each panel indicator also offers additional means of entry confirmation into divergence trades, for example, the Stochastic can indicate when it is crossing down from overbought or up from oversold, the TSi can indicate when the 2 TSI bands cross over one another upward or downward, and the UO and MFI can indicate an entry confluence when they are nearing, or crossing their centerlines, for more confidence in your divergence trade entries.
Additional information on the settings for this indicator can be found via the tooltips within the settings menu itself. Further information on feature updates, and usage tips & tricks will be added to the comments section below in due course.
Disclaimer: This indicator uses code adapted from the Divergence for Many v4 indicator authored by Lonesometheblue, and several stock indicators authored by Tradingview. With many thanks.

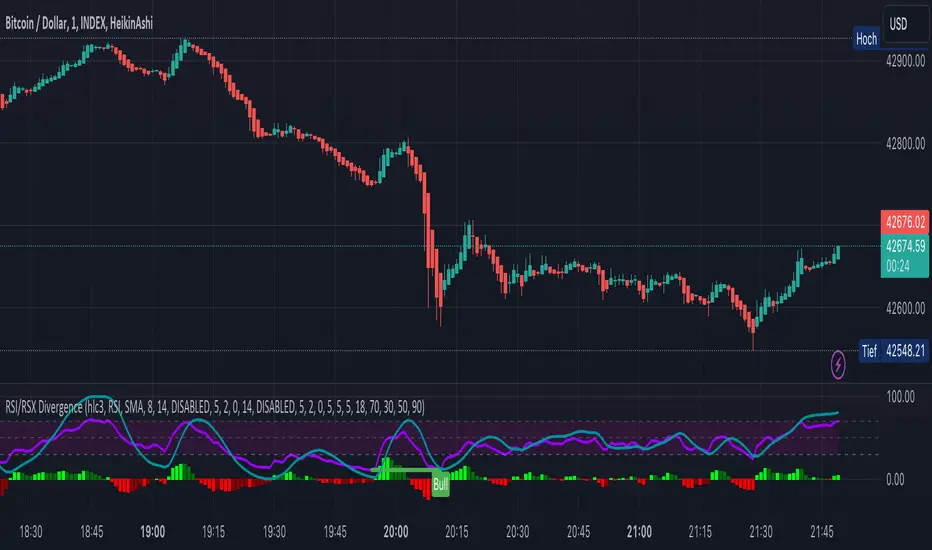
KINSKI RSI/RSX DivergenceThe Relative Strength Index (RSI) is a momentum indicator that measures the magnitude of recent price changes to analyse overbought or oversold conditions. RSI values range from 0 to 100.
The Relative Strength Index (RSI) is calculated using the following formula: RSI = 100 - 100 / (1 + RS) Where RS = average gain of upward phases during the specified time frame / average loss of downward phases during the specified time frame.
An asset price is considered overbought (due for a correction) if the RSI is above 70 and oversold (due for a recovery) if it is below 30. More extreme values (80/20) are also used to avoid false readings.
In a strong uptrend, the RSI often reaches 70 and above for long periods, and downtrends can remain at 30 or below for long periods.
Divergence detection in RSI is one of the important functions of this indicator. The reason is that an RSI divergence is a more reliable signal than the overbought and oversold indicators themselves. You will get overbought and oversold signals all the time. However, the divergence is a rare event.
In general, RSI divergence means that the RSI indicator is moving in the opposite direction compared to the price. So while the price is moving, the RSI is telling us in advance to expect a change in direction.
Positive RSI divergence
A positive RSI divergence is when the price trend has lower lows and lower highs, while the RSI indicator does the opposite - higher highs and higher lows. The price continues to fall while the RSI indicator begins to rise.
Negative RSI divergence
Negative RSI divergence is the opposite of positive divergence. It applies to uptrends where the price reaches higher highs and higher lows. However, the RSI shows lower highs and lower lows - the price goes up but the RSI goes down. The price closes with higher highs and higher lows, while the RSI indicator does the opposite - lower lows and lower highs, confirming a negative divergence. As a result, there is a sharp decline in the price.
RSX Indicator - Base script: SharkCIA by Jaggedsoft (Linked in the source code)
The RSX is the noise-free variant of the more popular RSI oscillator. Typically, any indicator can be smoothed by applying a moving average. However, a major disadvantage of such a method is that there is a time lag between the indicator and the price. RSX Indicator attempts to do this without signal delay.
What distinguishes this indicator from others of this type?
Display of RSI indicator together/alone with RSX and RSI smoothed
display of the RSI indicator (option: "RSI: On/Off")
display of the RSX indicator (option: "RSX: On/Off")
display of the RSI indicator as smoothed version (option: "RSI Smoothed: On/Off")
offers the possibility to choose between different view variants
many settings for additional information, layout and divergence identification
enables completely new comparison possibilities and insights with the additional RSI variants
Kinetic RSI [Vel + Accel] + AlertsThe Problem with Standard RSI
Most traders use the Relative Strength Index (RSI) to see if a market is "Overbought" (above 70) or "Oversold" (below 30). The problem? A strong trend can stay overbought for days, burning short sellers, or an asset can stay oversold while price continues to crash. Standard RSI tells you where the price is, but it doesn't tell you how hard it is moving.
The Solution: Kinetic RSI
This script reimagines RSI by applying basic physics concepts: Velocity and Acceleration.
Instead of asking "Is RSI below 30?", this indicator asks: "Is RSI below 35 AND did it just make a violent, high-speed turn upwards?"
It filters out lazy, drifting price action and only signals when momentum is accelerating in a new direction.
How It Works (The Math)
Velocity: We calculate the speed of the RSI change (Current RSI - Previous RSI).
Acceleration: We calculate if that speed is increasing (Current Velocity - Previous Velocity).
The Trigger: A signal is only generated if the RSI is in an extreme zone (<35 or >65) AND it has high Velocity AND positive Acceleration.
How to Trade It
1. The "Kick" Signals (Background Highlights)
🟢 Green Background (Bullish Kick): The RSI was low, but buyers stepped in aggressively. The momentum is not just positive; it is accelerating upward. This is often a "V-Bottom" catch.
🔴 Red Background (Bearish Kick): The RSI was high, but sellers slammed the price down. Momentum is accelerating downward.
2. The Line Color
Lime Line: Velocity is positive (Momentum is rising).
Fuchsia Line: Velocity is negative (Momentum is falling).
Usage: If the background flashes Green (Buy Signal), but the line turns back to Fuchsia (Red) a few bars later, the move has failed—exit the trade.
Settings & Alerts
RSI Length: Standard 14 (Adjustable).
Velocity Threshold: Controls sensitivity.
Lower (e.g., 2-3): More signals, catches smaller reversals.
Higher (e.g., 5+): Fewer signals, catches only massive "shocks" to the price.
Alerts Included: You can set alerts for "Bullish Kick," "Bearish Kick," or "Any Kick" to get notified of volatility spikes.
Best Practices
Wait for the Close: This indicator measures the closing velocity. Always wait for the bar to close to confirm the background color signal.
Trend Filtering: This works best as a "Reversal" indicator. If the market is in a super-strong uptrend, ignore the Bearish (Red) signals and only take the Bullish (Green) dips.

RSI Momentum ScalperOverview
The "RSI Momentum Scalper" is a Pine Script v5 strategy crafted for trading highly volatile markets, with a special focus on newly listed cryptocurrencies. This strategy harnesses the Relative Strength Index (RSI) alongside volume analysis and momentum thresholds to pinpoint short-term trading opportunities. It supports both long and short trades, managed with customizable take profit, stop loss, and trailing stop levels, which are visually plotted on the chart for easy tracking.
Why I Created This Strategy
I developed the "RSI Momentum Scalper" because I was seeking a reliable trading strategy tailored to newly listed, highly volatile cryptocurrencies. These assets often experience rapid price fluctuations, rendering traditional strategies less effective. I aimed to create a tool that could exploit momentum and volume spikes while managing risk through adaptable exit parameters. This strategy is designed to address that need, offering a flexible approach for traders in dynamic crypto markets.
How It Works
The strategy utilizes RSI to identify momentum shifts, combined with volume confirmation, to trigger long or short entries. Trades are controlled with take profit, stop loss, and trailing stop levels, which adjust dynamically as the price moves in your favor. The trailing stop helps lock in profits, while the plotted exit levels provide clear visual cues for trade management.
Customizable Settings
The script is highly customizable, allowing you to adjust it to various market conditions and trading styles. Here’s a brief overview of the key settings:
Trade Mode: Select "Both," "Long Only," or "Short Only" to determine the trade direction.
(Default: Both)
RSI Length: Sets the lookback period for the RSI calculation (2 to 30).
(Default: 8)
A shorter length increases RSI sensitivity, suitable for volatile assets.
RSI Overbought: Defines the upper RSI threshold (60 to 99) for short entries.
(Default: 90)
Higher values signal stronger overbought conditions.
RSI Oversold: Defines the lower RSI threshold (1 to 40) for long entries.
(Default: 10)
Lower values indicate stronger oversold conditions.
RSI Momentum Threshold: Sets the minimum RSI momentum change (1 to 15) to trigger entries.
(Default: 14)
Adjusts the sensitivity to price momentum.
Volume Multiplier: Multiplies the volume moving average to filter high-volume bars (1.0 to 3.0).
(Default: 1)
Higher values require stronger volume confirmation.
Volume MA Length: Sets the lookback period for the volume moving average (5 to 50).
(Default: 13)
Influences the volume trend sensitivity.
Take Profit %: Sets the profit target as a percentage of the entry price (0.1 to 10.0).
(Default: 4.15)
Determines when to close a winning trade.
Stop Loss %: Sets the loss limit as a percentage of the entry price (0.1 to 6.0).
(Default: 1.85)
Protects against significant losses.
Trailing Stop %: Sets the trailing stop distance as a percentage (0.1 to 4.0).
(Default: 2.55)
Locks in profits as the price moves favorably.
Visual Features
Exit Levels: Take profit (green), fixed stop loss (red), and trailing stop (orange) levels are plotted when in a position.
Performance Table: Displays win rate, total trades, and net profit in the top-right corner.
How to Use
Add the strategy to your chart in TradingView.
Adjust the input settings based on the cryptocurrency and timeframe you’re trading.
Monitor the plotted exit levels for trade management.
Use the performance table to assess the strategy’s performance over time.
Notes
Test the strategy on a demo account or with historical data before live trading.
The strategy is optimized for short-term scalping; adjust settings for longer timeframes if needed.

Capiba RSI + Ichimoku + VolatilidadeThe "Capiba RSI + Ichimoku + Volatility" indicator is a powerful, all-in-one technical analysis tool designed to provide traders with a comprehensive view of market dynamics directly on their price chart. This multi-layered indicator combines a custom Relative Strength Index (RSI), the trend-following Custom Ichimoku Cloud, and dynamic volatility lines to help identify high-probability trading setups.
How It Works
This indicator functions by overlaying three distinct, yet complementary, analysis systems onto a single chart, offering a clear and actionable perspective on a wide range of market conditions, from strong trends to periods of consolidation.
1. Custom RSI & Momentum Signals
The core of this indicator is a refined version of the Relative Strength Index (RSI). It calculates a custom Ultimate RSI that is more sensitive to price movements, offering a quicker response to potential shifts in momentum. The indicator also plots a moving average of this RSI, allowing for the generation of clear trading signals. Use RMAs.
Bar Coloring: The color of the price bars on your chart dynamically changes to reflect the underlying RSI momentum.
Blue bars indicate overbought conditions, suggesting trend and a potential short-term reversal.
Yellow bars indicate oversold conditions, hinting at a potential bounce.
Green bars signal bullish momentum, where the Custom RSI is above both 50 and its own moving average.
Red bars indicate bearish momentum, as the Custom RSI is below both 50 and its moving average.
Trading Signals: The indicator plots visual signals directly on the chart in the form of triangles to highlight key entry and exit points. A green triangle appears when the Custom RSI crosses above its moving average (a buy signal), while a red triangle marks a bearish crossunder (a sell signal).
2. Custom Ichimoku Cloud for Trend Confirmation
This component plots a standard Ichimoku Cloud directly on the chart, providing a forward-looking view of trend direction, momentum, and dynamic support and resistance levels.
The cloud’s color serves as a strong visual cue for the prevailing trend: a green cloud indicates a bullish trend, while a red cloud signals a bearish trend.
The cloud itself acts as a dynamic support or resistance zone. For example, in an uptrend, prices are expected to hold above the cloud, which provides a strong support level for the market.
3. Dynamic Volatility Lines
This final layer is a dynamic volatility channel that automatically plots the highest high and lowest low from a user-defined period. These lines create a visual representation of the recent price range, helping traders understand the current market volatility.
Volatility Ratio: A label is displayed on the chart showing a volatility ratio, which compares the current price range to a historical average. A high ratio indicates increasing volatility, while a low ratio suggests a period of price consolidation or lateral movement, a valuable insight for day traders.
The indicator is highly customizable, allowing you to adjust parameters like RSI length, overbought/oversold levels, Ichimoku periods, and volatility lookback periods to suit your personal trading strategy. It is an ideal tool for traders who rely on a combination of momentum, trend, and volatility to make well-informed decisions.
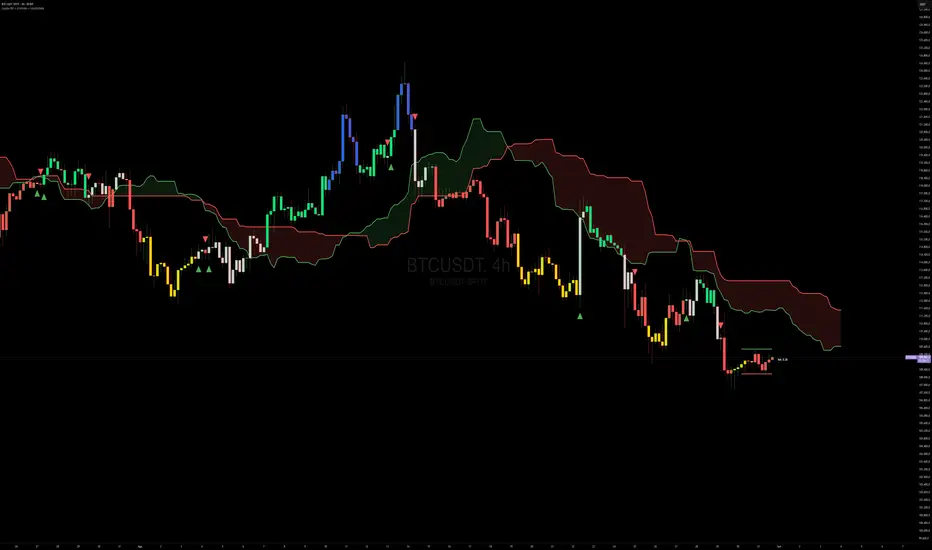
Candle Count RSI📈 Candle Count RSI — A Dual-Perspective Momentum Engine
The Candle Count RSI is a custom-built momentum oscillator that expands on the classic Relative Strength Index (RSI) by introducing a directional-only variant that tracks the frequency of bullish or bearish closes, rather than price magnitude. It gives traders a second lens through which to evaluate momentum, trend conviction, and subtle divergences—often invisible to traditional price-based RSI.
💡 What Makes It Unique?
While the standard RSI is sensitive to the size of price changes, the Candle Count RSI is magnitude-blind. It counts candle closes above/below open over a lookback period, generating a purer signal of directional consistency. To enhance signal fidelity, it includes a streak amplifier, dynamically weighting extended runs of green or red candles to reflect intensity of market bias—without introducing artificial price sensitivity.
This dual-RSI approach allows for:
- Divergence detection between directional bias and price magnitude.
- Smoother trend confirmation in choppy markets.
- Cleaner visual cues using dynamic glow and background logic.
📐 How Standard RSI Actually Works (Not What You Think)
RSI doesn’t just check if price went up or down over a span—it checks each individual candle and tracks whether it closed higher or lower than the one before. Here's how it works under the hood:
1.) For each bar, it calculates the change from the previous close.
2.) It separates those changes into gains (upward moves) and losses (downward moves).
3.) Then it computes a smoothed average of those gains and losses (usually using an RMA).
4.) It calculates the Relative Strength (RS) as:
RS = AvgGain / AvgLoss
5.) Finally, it plugs that into the RSI formula:
RSI = 100 - (100 / (1 + RS))
⚖️ What Does the 50 Line Mean?
- The RSI scale runs from 0 to 100, but 50 is the true neutral zone:
- RSI > 50 means average gains outweigh average losses over the period.
- RSI < 50 means losses dominate.
- RSI ≈ 50? The market is balanced—momentum is indecisive, no clear trend bias.
- This makes 50 a powerful midline for trend filters, directional bias tools, and divergence detection—especially when paired with alternative RSI logic like Candle Count RSI.
🔧 Inputs and Customization
- Everything is fully modular and customizable:
🧠 Core Settings
- RSI Length: Used for both the standard RSI and Candle Count RSI.
📉 Standard RSI
- Classic RSI calculation based on price changes.
- Optional WMA smoothing to reduce noise.
- Glow effect toggle with custom intensity.
🕯 Candle Count RSI
- Computes RSI using only the count of up/down candles.
- Optional smoothing for stability.
- Amplifies streaks (e.g., multiple consecutive bullish candles increase strength).
- Glow effect toggle with adjustable strength.
🎇 Glow Visuals
- Background glow (subpane and/or main chart).
- Fades based on RSI distance from the 50 midpoint.
- Independent color settings for bull and bear bias.
🧬 Divergence Zones
- Detects when Candle RSI and Standard RSI diverge.
- Highlights:
- Bullish Divergence: Candle RSI > 50, Standard RSI < threshold.
- Bearish Divergence: Candle RSI < 50, Standard RSI > threshold.
- Background fill optionally shown in subpane and/or main chart.
📊 Directional Histogram
- MACD-style histogram showing the difference between the two RSI lines.
- Color-coded based on directional agreement:
- Both rising → green.
- Both falling → red.
- Conflict → yellow.
🧠 Under the Hood — How It Works
🔹 Standard RSI
- Classic ta.rsi() applied to close prices, optionally WMA-smoothed.
🔹 Candle Count RSI (CCR)
- Counts how many candles closed up/down over the period.
- Computes a magnitude-free RSI from these counts.
- Applies a streak-based multiplier to exaggerate trend strength during consecutive green/red runs.
- Optionally smoothed with WMA to create a clean signal line.
- This makes CCR ideal for detecting true directional bias without being faked out by volatile price spikes.
🔹 Divergence Logic
- When Candle RSI and Standard RSI disagree strongly across defined thresholds, background fills highlight early signs of momentum decay or hidden accumulation/distribution.
🔹 Glow Logic
- Glow zones are controlled by a master toggle and drawn with dynamic transparency:
- Further from 50 = stronger conviction = darker glow.
- Shows up in subpane and/or main chart depending on user preference.
📷 Suggested Use Case / Visual Setup
- Use in conjunction with your primary price action system.
- Watch for divergences between the Candle Count RSI and Standard RSI for early trend reversals.
- Use glow bias zones on the main chart to get subconscious directional cues during fast scalping.
- Histogram helps you confirm when both RSI variants agree—useful during strong trending conditions.
🛠️ Tip for Traders
- This tool isn’t trying to “predict” price. It’s designed to visualize hidden market psychology—when buyers are showing up with consistent pressure, or when momentum has a disconnect between conviction and magnitude. Use this to filter entries, spot weak rallies, or sense when a trend is about to break down.
⚠️ WARNING
- Not for use with Heikin Ashi, Renko, etc.).
🧠 Summary
Candle Count RSI is not just another mashup—it's a precision-built, dual-perspective oscillator that captures directional conviction using real candle behavior. Whether you're scalping intraday or swing trading momentum, this script helps clarify trend integrity and exposes hidden weaknesses with elegance and clarity.
—
🛠️ Built by: Sherlock_MacGyver
Feel free to share feedback or reach out if you'd like to collaborate on custom features.

RSI Crossover Signal Companion - Alerts + Visuals🔷 RSI Crossover Signal Companion — Alerts + Visuals
The Relative Strength Index (RSI) is a momentum oscillator that measures the speed and change of recent price movements. It helps traders identify overbought or oversold conditions, possible trend reversals, and momentum strength.
This utility builds on TradingView’s classic Relative Strength Index (RSI) by adding real-time alerts and triangle markers when the RSI crosses its own moving average — a common technique for early momentum detection.
It is designed as a lightweight, visual companion tool for traders using RSI/MA crossover logic in manual or semi-automated strategies.
🔍 Features
✅ Preserves the full original RSI layout, including:
• Gradient fill and overbought/oversold zones
• Standard RSI input settings (length, source, etc.)
• MA smoothing options with user-defined type and length
🔺 Adds visual triangle markers:
🔼 Up triangle when RSI crosses above its MA
🔽 Down triangle when RSI crosses below its MA
📢 Built-in alerts for RSI/MA crosses:
“RSI Crossed Above MA”
“RSI Crossed Below MA”
📈 How to Use
This script is ideal for:
• Spotting early momentum shifts
• Confirming entries or exits in other systems (price action, trendlines, breakouts)
• Building alert-based automation (webhooks, bots, etc.)
Popular use cases:
• Combine with trend indicators like MA200 or MA12
• Use in confluence with price structure and divergence
• Validate breakout moves with momentum confirmation
⚙️ Customization
RSI length, MA length, MA type, and source are fully adjustable
Triangle marker size, shape, and color can be edited under Style
Alerts are pre-built and ready for use

Multi Scanner Plot & Table V1Here's how to interpret each column in the table:
Price vs MAs:
What it shows: Where the current price is relative to the short-term (e.g., 20-period) and long-term (e.g., 50-period) Simple Moving Averages (SMAs) calculated on your current chart's timeframe.
Interpretation:
Above Both (Green background): Price is above both the short and long MAs. Generally considered a bullish sign for the current trend.
Below Both (Red background): Price is below both MAs. Generally considered a bearish sign.
Mixed (Gray background): Price is between the two MAs (e.g., above the short but below the long, or vice-versa). Indicates indecision or a potential trend change.
RSI Value:
What it shows: The actual numerical value of the Relative Strength Index (RSI) calculated on your current chart's timeframe.
Interpretation: Just the raw RSI number (e.g., 65.32). The background is always gray. You compare this value to standard overbought/oversold levels (like 70/30) or the levels defined in the script's inputs.
RSI Status:
What it shows: Interprets the RSI Value based on the Overbought/Oversold levels set in the script's inputs (default 70/30). Calculated on your current chart's timeframe.
Interpretation:
Overbought (Red background): RSI is above the overbought level (e.g., > 70). Suggests the asset might be due for a pullback or reversal downwards. Red indicates a potentially bearish condition.
Oversold (Green background): RSI is below the oversold level (e.g., < 30). Suggests the asset might be due for a bounce or reversal upwards. Green indicates a potentially bullish condition.
Neutral (Gray background): RSI is between the oversold and overbought levels.
Last Sig Price:
What it shows: The price level where the last "SIG NOW" Buy or Sell signal occurred on your current chart's timeframe.
Interpretation: Helps you see the entry price of the most recent short-term signal generated by this script. The background color matches the signal type: Green for the last Buy signal, Red for the last Sell signal. N/A if no signal has occurred yet.
SIG NOW:
What it shows: This is the main short-term signal generated by the script based on conditions on your current chart's timeframe. It combines the "Price vs MAs" status and specific RSI conditions (price must be above/below both MAs and RSI must be within a certain range defined in the inputs).
Interpretation:
BUY (Green background): The specific buy conditions are met right now. (Price above both MAs AND RSI is strong but not necessarily overbought).
SELL (Red background): The specific sell conditions are met right now. (Price below both MAs AND RSI is weak but not necessarily oversold).
NEUTRAL (Gray background): Neither the Buy nor the Sell conditions are currently met.
ALERT:
What it shows: Flags unusual volume activity on the current bar compared to the recent average volume (calculated on your current chart's timeframe).
Interpretation:
SPIKE (Yellow background, black text): Current volume is significantly higher than the recent average (defined by the Volume Spike Multiplier). Can indicate strong interest or a potential climax.
DUMP (Purple background): Current volume is significantly lower than the recent average (defined by the Volume Dump Multiplier). Can indicate fading interest.
NONE (Gray background): Volume is within the normal range for the lookback period.
SD$:
What it shows: The price level where the last Volume Spike or Dump occurred on your current chart's timeframe.
Interpretation: Shows the price associated with the most recent significant volume event. The background color indicates the type of the last event: Green if the last event was a Spike, Red if the last event was a Dump. N/A if no Spike/Dump has occurred yet.
BB Value (%B):
What it shows: This relates to Bollinger Bands, but specifically calculated on a Higher Timeframe (HTF) that you can set in the inputs (e.g., Daily BBs while viewing an Hourly chart). It shows the Bollinger Band Percent B (%B) value for that HTF. %B measures where the HTF closing price is relative to the HTF upper and lower bands.
Interpretation:
Value > 1: HTF price closed above the HTF upper Bollinger Band.
Value < 0: HTF price closed below the HTF lower Bollinger Band.
Value between 0 and 1: HTF price closed within the HTF Bollinger Bands (e.g., 0.5 is exactly on the middle band).
The background is always gray.
LTS (Long Term Signal):
What it shows: A signal derived only from the Higher Timeframe (HTF) Bollinger Bands.
Interpretation:
BUY (Green background): The HTF price closed above the HTF upper Bollinger Band (see BB Value > 1). Considered a strong bullish signal from the higher timeframe perspective.
SELL (Red background): The HTF price closed below the HTF lower Bollinger Band (see BB Value < 0). Considered a strong bearish signal from the higher timeframe perspective.
NEUTRAL (Gray background): The HTF price closed within the HTF Bollinger Bands.
How to Understand Bollinger Bands and Signals in this Context:
Bollinger Bands are primarily used for the Long Term Signal (LTS) column. This script calculates BBs on a higher timeframe (you choose which one, or it defaults to the chart's timeframe if left blank).
The "LTS" signal triggers:
A BUY when the price on that higher timeframe closes above its upper Bollinger Band. This often indicates strong momentum or a potential breakout.
A SELL when the price on that higher timeframe closes below its lower Bollinger Band. This often indicates strong negative momentum or a potential breakdown.
The "BB Value" column gives you the raw %B number from that same higher timeframe, showing you exactly where the price is relative to the bands (is it just barely above/below, or way outside?).
The script does not directly use Bollinger Bands from the current chart timeframe for the "SIG NOW" or other table signals. The main short-term signals ("SIG NOW") rely on Moving Averages and RSI on the current timeframe. The LTS provides a longer-term perspective using HTF Bollinger Bands.
In summary: Look at the table to quickly gauge:
Short-term trend (Price vs MAs).
Short-term momentum (RSI Status, SIG NOW).
Recent short-term entry points (Last Sig Price).
Current volume anomalies (ALERT).
Long-term strength/weakness based on HTF Bollinger Bands (LTS, BB Value).
Combine these pieces of information to get a more rounded view of the current market conditions according to this specific script's logic.

Frozen Bias Zones – Sentiment Lock-insOverview
The Frozen Bias Zones indicator visualizes market sentiment lock-ins using a combination of RSI, MACD, and OBV. It creates "bias zones" that indicate whether the market is in a sustained bullish or bearish phase. These zones are then highlighted on the chart, helping traders spot when the market is locked in a bias. The script also detects breakout events from these zones and marks them with clear labels for easier decision-making.
Features
Multi-Indicator Sentiment Analysis: Combines RSI, MACD, and OBV to detect synchronized bullish or bearish sentiment.
Frozen Bias Zones: Identifies and visually represents zones where the market has remained in a particular sentiment (bullish or bearish) for a defined period.
Breakout Alerts: Displays labels to indicate when the price breaks out of the established bias zone.
Customizable Inputs: Adjust the zone duration, RSI, MACD, and breakout label visibility.
Input Parameters
Bias Duration (biasLength)
The minimum number of candles the market must stay in a specific sentiment to consider it a "Frozen Bias Zone".
Default: 5 candles.
RSI Period (rsiPeriod)
Period for the Relative Strength Index (RSI) calculation.
Default: 14 periods.
MACD Settings
MACD Fast (macdFast): The fast-moving average period for the MACD calculation.
Default: 12.
MACD Slow (macdSlow): The slow-moving average period for the MACD calculation.
Default: 26.
MACD Signal (macdSig): The signal line period for MACD.
Default: 9.
Show Break Label (showBreakLabel)
Toggle to show labels when the price breaks out of the bias zone.
Default: True (shows label).
Bias Zone Colors
Bullish Bias Color (bullColor): The color for bullish zones (light green).
Bearish Bias Color (bearColor): The color for bearish zones (light red).
How It Works
This indicator analyzes three key market metrics to determine whether the market is in a bullish or bearish phase:
RSI (Relative Strength Index)
Measures the speed and change of price movements. RSI > 50 indicates a bullish phase, while RSI < 50 indicates a bearish phase.
MACD (Moving Average Convergence Divergence)
Measures the relationship between two moving averages of the price. A positive MACD histogram indicates bullish momentum, while a negative histogram indicates bearish momentum.
OBV (On-Balance Volume)
Uses volume flow to determine if a trend is likely to continue. A rising OBV indicates bullish accumulation, while a falling OBV indicates bearish distribution.
Bias Zone Detection
The market sentiment is considered bullish if all three indicators (RSI, MACD, and OBV) are bullish, and bearish if all three indicators are bearish.
Bullish Zone: A zone is created when the market sentiment remains bullish for the duration of the specified biasLength.
Bearish Zone: A zone is created when the market sentiment remains bearish for the duration of the specified biasLength.
These bias zones are visually represented on the chart as colored boxes (green for bullish, red for bearish).
Breakout Detection
The script automatically detects when the market exits a bias zone. If the price moves outside the bounds of the established zone (either up or down), the script will display one of the following labels:
Bias Break (Up): Indicates that the price has broken upwards out of the zone (with a green label).
Bias Break (Down): Indicates that the price has broken downwards out of the zone (with a red label).
These labels help traders easily identify potential breakout points.
Example Use Case
Bullish Market Conditions: If the RSI is above 50, the MACD histogram is positive, and OBV is increasing, the script will highlight a green bias zone. Traders can watch for potential bullish breakouts or trend continuation after the zone ends.
Bearish Market Conditions: If the RSI is below 50, the MACD histogram is negative, and OBV is decreasing, the script will highlight a red bias zone. Traders can look for potential bearish breakouts when the zone ends.
Conclusion
The Frozen Bias Zones indicator is a powerful tool for traders looking to visualize prolonged market sentiment, whether bullish or bearish. By combining RSI, MACD, and OBV, it helps traders spot when the market is "locked in" to a bias. The breakout labels make it easier to take action when the price moves outside of the established zone, potentially signaling the start of a new trend.
Instructions
To use this script:
Add the Frozen Bias Zones indicator to your TradingView chart.
Adjust the input parameters to suit your trading strategy.
Observe the colored bias zones on your chart, along with breakout labels, to make informed decisions on trend continuation or reversal.

RSI VWAP POC [Uncle Sam Trading]Category: Oscillators, Volume, Market Profile
Timeframe: Suitable for all timeframes
Markets: Crypto, Forex, Stocks, Commodities
Overview
The RSI VWAP POC indicator is a powerful and innovative oscillator that combines the Relative Strength Index (RSI), Volume-Weighted Average Price (VWAP), and Point of Control (POC) from market profile analysis. Designed to provide traders with clear, high-probability trading signals, this indicator helps you identify key market levels, spot overbought/oversold conditions, and time your entries and exits with precision. Whether you’re a day trader, swing trader, or scalper, this free tool adds significant value to your trading strategy by offering a unique blend of momentum, volume, and market profile insights.
How It Works
This indicator integrates three core components to deliver actionable insights:
RSI (Relative Strength Index): Measures momentum to identify overbought (above 70) and oversold (below 30) conditions, helping you anticipate potential reversals.
VWAP (Volume-Weighted Average Price): Calculates a volume-weighted price benchmark, which is used to compute a more accurate, volume-sensitive RSI. This ensures the indicator reflects true market dynamics.
POC (Point of Control): Derived from market profile analysis, the POC represents the price level with the highest traded volume in a session, acting as a critical support or resistance level.
The indicator plots a smoothed RSI based on VWAP, overlaid with market profile data on a user-defined higher timeframe (default: 4H). The POC is displayed as a red line, with aqua bars indicating the value area where the majority of trading volume occurred. When the RSI crosses the POC, the indicator generates clear buy and sell signals:
Strong Buy (SBU): RSI crosses above the POC in an oversold zone.
Strong Sell (SBD): RSI crosses below the POC in an overbought zone.
Additional features include:
Background colors to highlight bullish (green) or bearish (red) trends.
Shaded zones for overbought (70/60) and oversold (30/40) levels.
Customizable settings to fit your trading style and timeframe.
How This Indicator Adds Value
The RSI VWAP POC indicator offers several key benefits that enhance your trading performance:
High-Probability Signals: By combining RSI, VWAP, and POC, this indicator identifies trades at key market levels where price is likely to react, increasing your win rate.
Improved Timing: Clear buy and sell signals, such as ‘SBU’ and ‘SBD’, help you enter and exit trades at optimal points, maximizing profitability.
Risk Management: Overbought/oversold zones and trend confirmation via background colors help you avoid false signals, protecting your capital.
Versatility: Suitable for all markets (crypto, forex, stocks) and timeframes, making it a valuable tool for traders of all experience levels.
Time Efficiency: The indicator does the heavy lifting by analyzing momentum, volume, and market profile data, allowing you to focus on executing trades.
Real-World Performance Example: On a 1-hour Bitcoin chart with a 4-hour higher timeframe, this indicator identified a strong sell signal on April 6th at 12:00 ($82,000), leading to a 9% drop to $74,600. A subsequent strong buy signal on April 7th at 04:00 ($76,200) captured a 6% rise to $81,200 – a potential 25% profit with 5x leverage if exited at 5%.
How to Use
Add the Indicator: Search for “RSI VWAP POC ” in TradingView’s indicator library and add it to your chart.
Set Your Timeframe: The indicator works on any timeframe but is optimized for a 1-hour chart with a 4-hour higher timeframe (set in the settings).
Interpret Signals:
Look for ‘SBU’ (strong buy) labels when the RSI crosses above the POC in an oversold zone, indicating a potential buying opportunity.
Look for ‘SBD’ (strong sell) labels when the RSI crosses below the POC in an overbought zone, signaling a potential selling opportunity.
Use the background colors (green for bullish, red for bearish) to confirm the trend.
Combine with Your Strategy: Use the indicator alongside your existing analysis (e.g., support/resistance, candlestick patterns) for best results.
Settings and Customization
The indicator is highly customizable to suit your trading needs:
RSI Length (Default: 14): Adjust the sensitivity of the RSI. Use a shorter length (e.g., 10) for scalping, or a longer length (e.g., 20) for smoother signals.
EMA Smoothing Length (Default: 3): Smooths the RSI line. Increase to 5 or 7 for less choppy signals in volatile markets.
Higher Timeframe (Default: 240 minutes): Set to 240 (4 hours) for a 1-hour chart. Adjust based on your chart’s timeframe (e.g., 60 minutes for a 15-minute chart).
Value Area Percentage (Default: 100%): Defines the size of the value area around the POC. Lower to 70% for a tighter focus on key levels.
Overbought/Oversold Thresholds (Defaults: 70/30): Adjust these levels to match market conditions (e.g., 80/20 for trending markets).
Show POC Line (Default: True): Toggle the red POC line on or off.
Show Buy/Sell Signals: Enable ‘Show Strong Breakup Signals’ and ‘Show Strong Breakdown Signals’ to focus on high-probability trades.
Why Choose This Indicator?
The RSI VWAP POC indicator stands out by offering a unique combination of momentum, volume, and market profile analysis in a single, easy-to-use tool. It’s designed to help traders of all levels make informed decisions, reduce risk, and increase profitability. Whether you’re trading Bitcoin, forex pairs, or stocks, this indicator provides the clarity and precision you need to succeed.
